Tag: Year 6

  • How the Probability Line Helped Zane Decode the Alien Signals

    How the Probability Line Helped Zane Decode the Alien Signals

    It started with a sigh that felt like it rattled the kitchen windows. Zane, a bright Year 6 student, was slumped over his homework, pencil hovering aimlessly above a worksheet filled with “misleading data” and complex probability percentages. To his parents, it looked like a standard math assignment. To Zane, it was an alien language he couldn’t translate. He was frustrated, overwhelmed, and convinced that math was simply “not his thing.”

    The Common Mistake

    The problem wasn’t Zane’s intelligence; it was the way the abstract numbers were presented. Schools often teach probability using dry tables and complex definitions. When students are asked to convert fractions, decimals, and percentages while simultaneously identifying why a graph might be misleading, the lack of visual context causes their brains to freeze. They get caught in the “calculation trap,” losing sight of what the numbers actually represent.

    The Guide: The Probability Line Method

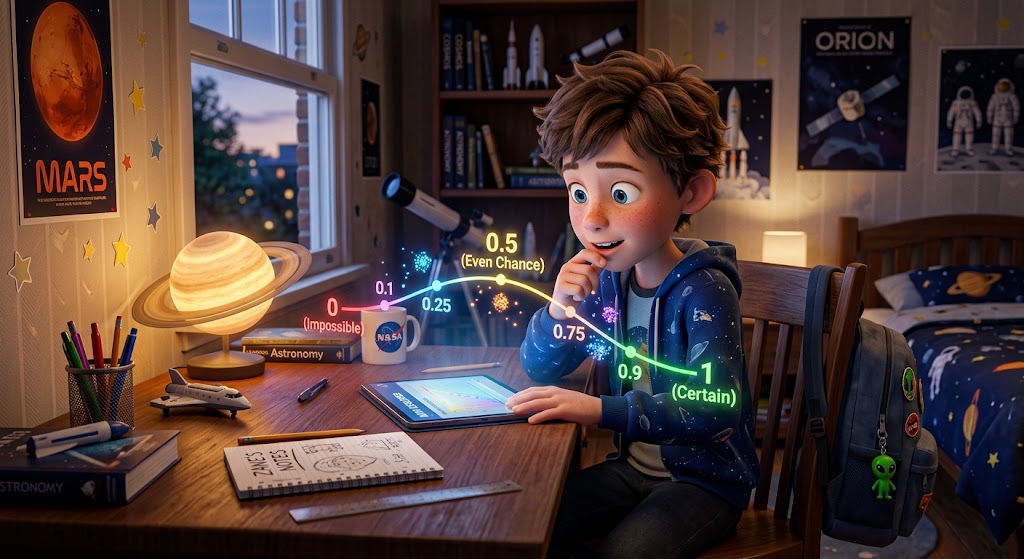
    To help Zane, we didn’t just ask him to calculate; we taught him the Probability Line Method. This visual tool acts like a map for uncertainty. We draw a straight line from 0 (Impossible) to 1 (Certain), with 0.5 (Even Chance) in the middle. By mapping alien signal frequencies or spaceship landing odds onto this line, Zane could instantly see whether an event was unlikely, likely, or certain. This transformed abstract jargon into a visual map he could trust.

    The Transformation

    Zane encountered a tough question: “An alien report claims an 80% chance of landing on Earth, but the graph only shows 2 out of 10 attempts were successful. Is this data misleading?”

    Instead of panicking, Zane used his Probability Line. He marked 0.8 on the line. Then, he converted the 2 out of 10 attempts to 0.2. He placed 0.2 on the line. The visual gap between 0.2 and 0.8 made it immediately obvious that the report’s claim was heavily exaggerated and likely misleading. Zane smiled, closed his book, and finished the rest of the page in minutes. He didn’t just solve the math; he mastered the logic.

    Turn Homework Battles into Victories

    Is your child struggling to bridge the gap between abstract math concepts and real-world logic? Math anxiety thrives on confusion, but it dissolves with the right story. At EinstyAI, we transform dry curriculum requirements into engaging, custom-tailored stories that help children like Zane see the beauty behind the numbers. Visit us today to turn your next homework session into a breakthrough.


    Practice Questions: The Alien Frequency Files

    Question 1

    Zane is tracking signals from the planet Zorg. The report says there is a 0.25 chance of receiving a clear message. If you were to plot this on a probability line, where does it sit?

    A) Between 0 and 0.25

    B) At the 1/4 mark

    C) At the 3/4 mark

    D) Between 0.5 and 1

    Question 2

    A Zorgian news broadcast claims “Alien sightings have exploded!” and shows a graph where the bar for “Sightings” is ten times taller than the bar for “No Sightings.” However, the data table shows 51 sightings and 49 non-sightings. Why is this graph misleading?

    A) The sightings should be higher.

    B) The graph starts at 48 instead of 0, exaggerating the difference.

    C) The math is correct; sightings are definitely higher.

    D) Percentages should have been used instead of raw numbers.

    Question 3

    Zane calculates that there is a 50% chance the alien spaceship will refuel at the moon. How would you represent this as a fraction?

    A) 1/10

    B) 1/4

    C) 1/2

    D) 1/5
  • How the Super-Stacker Strategy Helped Kai Save the Hero HQ

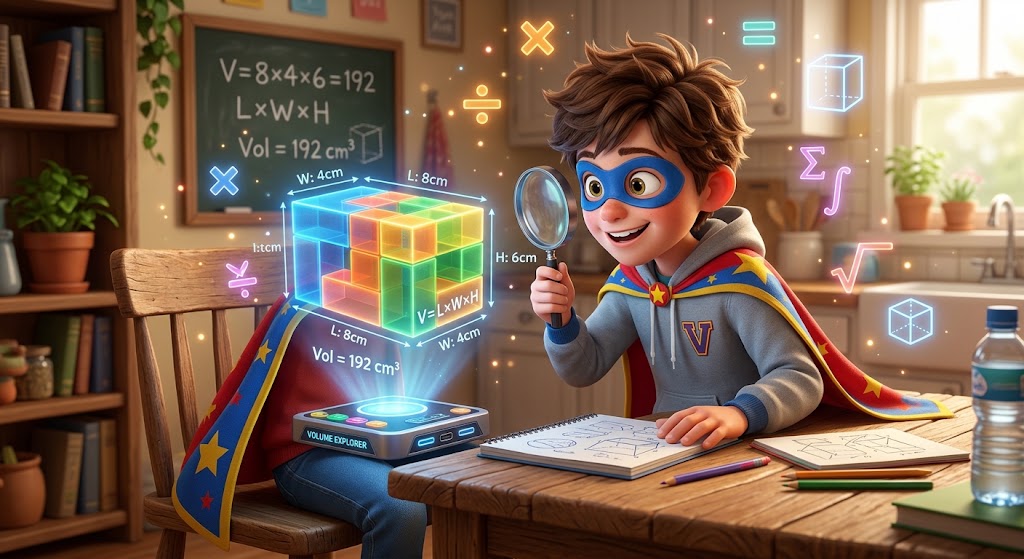
    How the Super-Stacker Strategy Helped Kai Save the Hero HQ

    Does your kitchen table look like a crime scene every time Year 6 math homework comes around? You are not alone. Many parents tell us that their children treat math like a chore to be endured, especially when they move into the Stage 3 curriculum and start dealing with the abstract concepts of volume and cubic units.

    Recently, we met a parent whose son, Kai, was in tears over a simple worksheet on rectangular prisms. Kai is a bright kid who loves video games, but when he saw the grid-based volume problems, he froze. He tried to count every individual cube in the diagram, lost his place, and ended up guessing.

    The myth that “some kids aren’t math kids” is exactly that—a myth. Kai’s frustration didn’t stem from a lack of intelligence. It stemmed from a disconnect between the visual reality of his world and the dry, academic symbols on the page.

    The Common Mistake: Counting Cubes One-by-One

    Most students try to count every single cubic unit in a rectangular prism because they are taught to “find the volume” without being taught to “see the structure.” This creates massive cognitive load. When students try to count 24 or 30 cubes individually, they make errors, get tired, and eventually, decide that math is just too hard.

    The Guide: The Super-Stacker (Layering) Strategy

    Instead of counting every cube, we teach students to use the Super-Stacker Strategy.

    Think of a rectangular prism not as a solid block, but as a stack of flat layers, exactly like a stack of pancakes or a building’s floor plan.

    1. Identify the Base: Find the number of cubes in the bottom layer (the “floor”).
    2. Count the Height: Count how many layers (the “floors”) there are.
    3. Multiply: Multiply the base layer by the number of layers.

    This transforms a messy counting task into a simple multiplication problem.

    Kai’s Transformation: Saving the Hero HQ

    When Kai looked at the prism on his homework—a box 4 cubes wide, 3 cubes deep, and 2 cubes high—he didn’t panic. He visualized it as his superhero HQ.

    “Okay,” Kai said, “The floor is 4 by 3. That’s 12 cubes on the ground level.”

    Then he looked at the height. “And there are 2 layers total. So, 12 cubes times 2 layers… that’s 24 cubic units!”

    He didn’t just find the right answer; he understood why the answer was 24. The stress melted away, replaced by the satisfaction of solving a puzzle.

    Turn Homework Battles into Victories

    You don’t need to be a math expert to help your child. You just need to change the context. By grounding these concepts in visual logic—like building a superhero base—we help children see the patterns in the world around them.

    Stop the homework battles. Transform your child’s practice into an engaging story that aligns with their curriculum. Visit EinstyAI today to get custom, story-based math resources that make your child the hero of their own learning journey.


    PRACTICE QUESTIONS

    Theme: The Super-Stacker’s Mission to Save Hero HQ

    Mission: Calculate the volume of your secret base components using the Layering Strategy.

    Question 1

    Your secret headquarters has a foundation that is 5 cubes long and 4 cubes wide. If your HQ is 3 layers high, what is the total volume in cubic units?

    A) 20

    B) 60

    C) 12

    D) 40

    Question 2

    You are designing a super-shield box that is 2 cubes long, 2 cubes wide, and 4 cubes high. How many cubic units of space does the shield take up?

    A) 8

    B) 16

    C) 12

    D) 4

    Question 3

    The Villain’s Trap is a rectangular prism that is 6 cubes long and 2 cubes wide. It is 3 layers high. What is the volume?

    A) 11

    B) 18

    C) 36

    D) 24

  • Why Does Your Child Treat Negative Coordinates Like an Impossible Maze?

    Why Does Your Child Treat Negative Coordinates Like an Impossible Maze?

    Why does your Year 6 student freeze up the moment they see a coordinate plane with negative numbers? If math homework feels like a battleground, you are not alone. Parents often worry that their child lacks a “math brain” or that Year 6 math is simply too advanced.

    The truth is rarely about lack of ability. It is about a lack of visualization. When children only experience the first quadrant—where everything is positive and simple—the sudden introduction of the other three quadrants feels like learning a new language. They don’t need more drills; they need a better map.

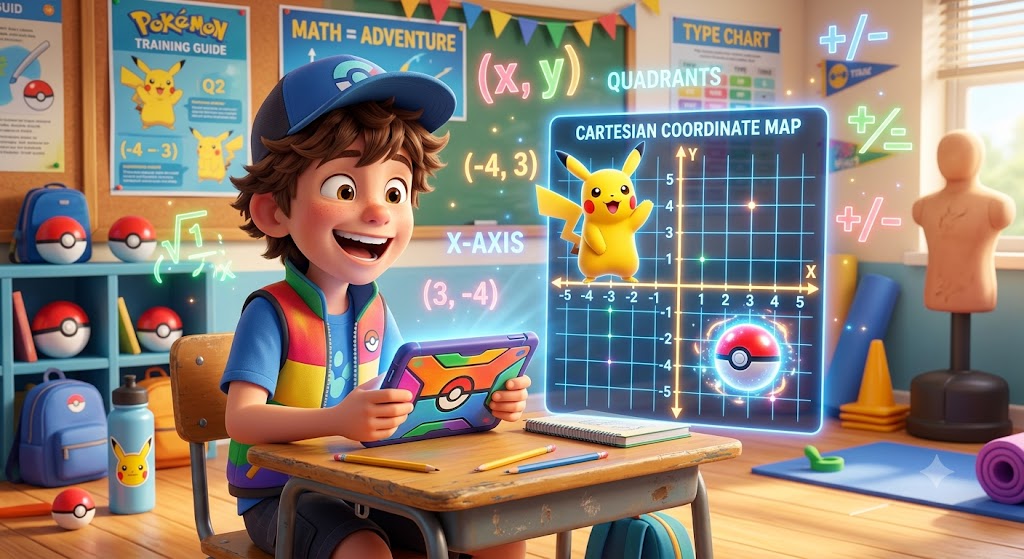
    The Cartesian Plane: It’s Just a Battle Map

    In Year 6, students must master the Cartesian plane across all four quadrants. If they struggle, it is usually because they are trying to memorize rules rather than understanding the space.

    Stop treating the grid as an abstract chart. Instead, teach your child to see the coordinate plane as a game map. The axes are just the North, South, East, and West boundaries of their playing field.

    When your child plots a point in the third quadrant, they aren’t “doing integers”; they are moving their character to a specific location on the map. By grounding these coordinates in a narrative context, the math becomes intuitive.

    Strategies for Four-Quadrant Mastery

    The “drill and kill” method fails because it bores the student and ignores their natural pattern-spotting abilities. Here is how to shift their mindset today:

    • Master the Quadrant Logic: Ensure they understand that the axes are simply lines. The x-axis is horizontal (left/right) and the y-axis is vertical (up/down). The signs determine the direction: positive is right or up, and negative is left or down.
    • Use Visual Anchors: If your child is stuck, draw the “plus sign” grid. Label the four sections clearly. Encourage them to physically trace the path from the origin (0,0) to the target coordinate with their finger.
    • Gamify the Practice: At EinstyAI, we create stories where coordinates represent locations of rare items or creatures. When math is the key to winning a game, anxiety disappears.

    Math isn’t a wall to hit; it’s a tool to build their own world. Don’t wait for the next homework frustration to start. Help your child visualize the math, and watch their confidence skyrocket.

    Practice Questions

    The Pokétraining Coordinate Challenge

    Question 1: The Starting Point

    A rare Pikachu is spotted at coordinate (-3, 2). Which quadrant is this Pokémon hiding in?

    A) Quadrant 1

    B) Quadrant 2

    C) Quadrant 3

    D) Quadrant 4

    Question 2: The Evolution Jump

    Your Charizard is located at (2, -1). You move it 3 units to the left and 4 units up to reach the gym. What are the new coordinates of your Charizard?

    A) (-1, 3)

    B) (5, 3)

    C) (-1, -5)

    D) (5, -5)

    Question 3: Finding the Berry

    A Sitrus Berry is buried at (-4, -4). To get there from the center (origin 0,0), how many units left and how many units down must you travel?

    A) 4 units left, 4 units up

    B) 4 units right, 4 units down

    C) 4 units left, 4 units down

    D) 4 units right, 4 units up

  • How to Explain Multiplying and Dividing Decimals by 10, 100, and 1000 to Year 6 Students?

    How to Explain Multiplying and Dividing Decimals by 10, 100, and 1000 to Year 6 Students?

    Why does my child panic the moment a decimal point appears in their homework?

    If you have ever watched your Year 6 student freeze up at a math problem, you are not alone. Parents often assume their child just isn’t a “math kid” or that they lack natural talent. The reality is usually simpler: they are missing the visual mental model for place value.

    Math homework does not have to be a battle. When students view math as a set of rigid, confusing rules, they struggle. When they view it as a pattern-spotting game, they succeed.

    The Secret: Stop Calculating, Start Sliding

    The biggest mistake students make is trying to perform traditional multiplication or division when dealing with powers of 10. They try to line up numbers vertically and carry values, which leads to mistakes.

    Instead, teach them the “Decimal Slide.”

    The decimal point does not move; the digits move. When multiplying by 10, 100, or 1000, the digits of the number slide to the left into larger place value columns. When dividing, they slide to the right into smaller columns.

    Using Storytelling to Make It Stick

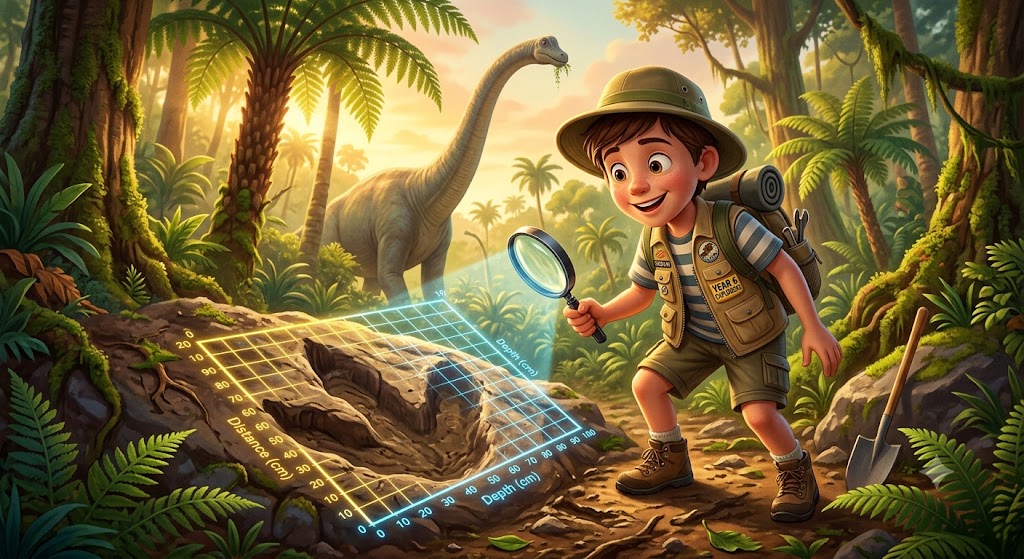
    Abstract numbers are hard to remember. Prehistoric creatures are not.

    If we talk about a T-Rex egg weighing 2.5 kilograms, students immediately picture the weight. If we then “multiply by 10” to see what a nest of 10 eggs weighs, the calculation becomes a tangible, visual narrative. By anchoring these concepts in stories—like those we build at EinstyAI—we remove the “math anxiety” barrier and replace it with engagement.

    Master the Pattern Today

    Do not rely on repetitive drills that bore your child. Help them visualize the movement of numbers.

    Key Takeaways for Parents:

    • Focus on Place Value: Remind them that the decimal point is just a marker for where the “ones” column ends.
    • Use Visual Aids: If they get stuck, draw a place value chart with columns (Hundreds, Tens, Ones, . Tenths, Hundredths).
    • Consistency is Key: Practice with real-world scenarios, not just dry equations on a page.

    Want to see how this works in practice? See the “Prehistoric Decimal Hunt” worksheet below to turn your child’s next math session into an adventure.

    Practice Questions

    The Prehistoric Decimal Hunt: Worksheet

    Instructions: Help our paleontologists solve these dinosaur discoveries by multiplying and dividing decimals!

    Question 1

    A baby T-Rex weighs 4.25 kg. After a month of eating ferns and forest snacks, its weight has multiplied by 10. What does the T-Rex weigh now?

    A) 42.5 kg

    B) 425 kg

    C) 0.425 kg

    D) 4.250 kg

    Question 2

    A Triceratops footprint is 350.5 cm long. To calculate the scale for a model footprint that is 1/10th the size, you must divide the length by 10. How long is the model footprint?

    A) 3505 cm

    B) 35.05 cm

    C) 3.505 cm

    D) 350.5 cm

    Question 3

    A Pterodactyl glides across a canyon measuring 1.25 km. If a map maker wants to convert this distance into metres, they multiply the value by 1000. What is the distance in metres?

    A) 12.5 metres

    B) 125 metres

    C) 1250 metres

    D) 12500 metres

  • How do I help my Year 6 student master BODMAS and negative numbers?

    How do I help my Year 6 student master BODMAS and negative numbers?

    Does your Year 6 student know their multiplication tables by heart but freeze the moment they see a negative number or a long string of operations? You are not alone. Parents frequently worry that their children lack “math ability,” but the real issue is rarely intelligence. It is a disconnect in logic.

    In Stage 3 (B) of the NSW curriculum, students transition from simple arithmetic to structural thinking. This is where many students hit a wall. They treat math as a linear race—calculating from left to right without pause. When they encounter negative integers on a number line or complex equations requiring the order of operations (BODMAS), this “left-to-right” habit fails.

    The “Math Isn’t a Race” Mindset

    The biggest mistake parents make is focusing on speed. Speed encourages guessing. Instead, focus on structure. When your child sees a math problem, ask them to identify the “rules of the road” first.

    BODMAS (Brackets, Orders, Division, Multiplication, Addition, Subtraction) is not just a mnemonic; it is a GPS. It tells the student exactly where to turn. Without this roadmap, a problem like 3 + 5 x 2 becomes a guessing game. By teaching students to pause and circle the “Order of Operations” first, you remove the anxiety of the unknown. They stop guessing the answer and start following the logic.

    Negative Numbers are Real-World Concepts

    Negative integers often cause panic because they are abstract. To a student, -10 is just a scary symbol. To a student who thinks of it as “10 degrees below freezing” or “10 meters below sea level,” it is a location.

    When your child struggles with negative numbers, stop writing equations on a napkin. Use visual tools. Draw a vertical number line (like a thermometer or the ocean depth). Let them see that -5 is actually warmer than -10. Physicalizing the number line bridges the gap between abstract symbol and reality.

    Practical Tips for Home

    1. Slow Down to Speed Up: Before solving, ask: “What does BODMAS tell us to do first?” If they can identify the operation (e.g., the multiplication inside the brackets), they have already won half the battle.
    2. Context is King: If the math is about debt, temperature, or depth, it becomes a story. Stories are memorable. Abstract numbers are forgettable.
    3. Use Tools: EinstyAI allows you to input these concepts and generate customized stories that turn these abstract challenges into engaging scenarios.

    Stop battling over rote practice. Build the mental models now, and the results will follow. Start by asking, “What is the order, and where are we on the number line?”

    Practice Questions

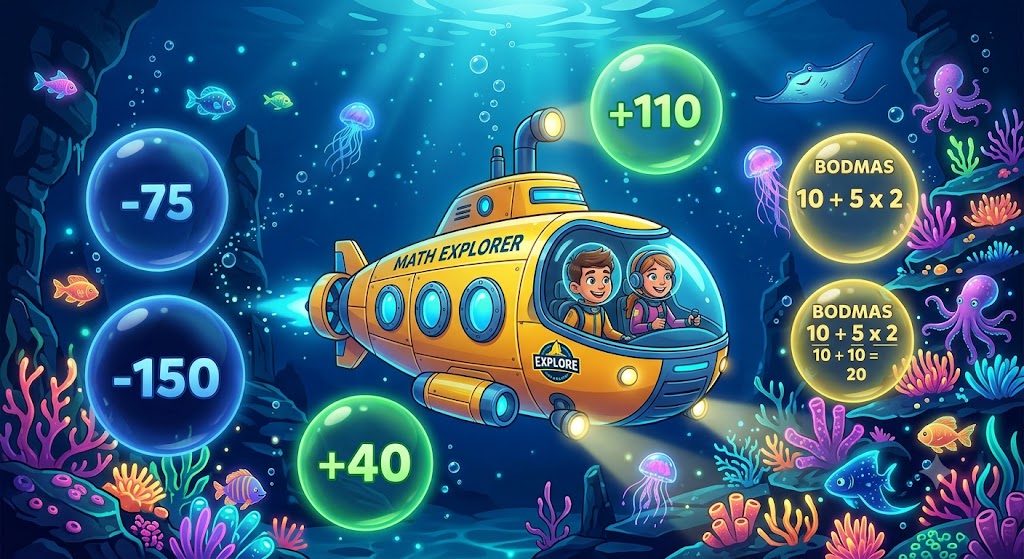
    The Deep Sea Explorer Challenge

    Welcome, Explorer! You are piloting the Abyss-1 submarine. To navigate the ocean floor safely and manage your oxygen levels, you must master the order of operations and understand your depth.

    Question 1

    Your submarine is at a depth of 150 metres below sea level (-150m). You rise 40 metres to avoid a coral reef. What is your new depth?

    A) -190m

    B) -110m

    C) 110m

    D) 190m

    Question 2

    The ocean temperature at your current depth is 4 degrees. A cold current drops the temperature by 7 degrees. What is the new temperature?

    A) 11 degrees

    B) 3 degrees

    C) -3 degrees

    D) -11 degrees

    Question 3

    Your ship’s computer needs to calculate oxygen pressure. The formula is 10 + 5 x 2. According to BODMAS, what is the correct pressure level?

    A) 30

    B) 20

    C) 15

    D) 25