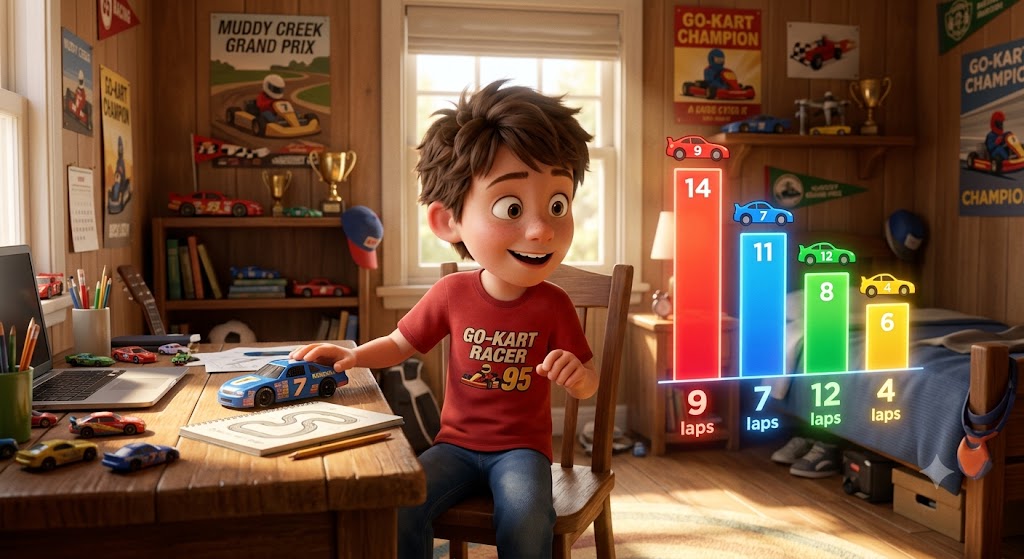
The kitchen table was littered with crumpled paper, and seven-year-old Max was in tears. Before him sat a worksheet about race cars and probability, but he was stuck on a bar graph that didn’t look like the ones he knew. “It doesn’t make sense!” he sobbed. His mother felt that familiar, sinking feeling—the frustration of watching her bright child freeze up over a math problem that should be straightforward.
The trouble wasn’t the math; it was the visual context. Traditional teaching often starts with simple one-to-one graphs, so when children like Max encounter graphs where one symbol represents five or ten cars, they panic. They instinctively count the symbols one by one, arriving at the wrong answer and feeling discouraged when the numbers don’t add up.
The Scale-Check Strategy: Your Child’s New Visual Weapon
To help Max, we introduced the Scale-Check Strategy. This simple, three-step technique transforms abstract data into a clear story. Instead of diving straight into the bars, we teach children to treat the graph like a treasure map:
- Find the Key: Look for the legend or scale indicator first.
- Label the Multiplier: Write the scale value next to each bar (e.g., if one car = 5, write the total).
- Read the Probability: Now that the numbers are real, identifying the “likely” or “unlikely” outcomes becomes easy.
By using this visual map, Max stopped guessing and started calculating. When he looked at the racing graph, he wasn’t looking at “three cars”; he was looking at “fifteen wins.” The panic vanished, replaced by the confidence of a driver who knows exactly how fast his car can go.
Turning Homework Battles into Victories
Mathematics shouldn’t be a source of anxiety. When we align learning with engaging interests—like racing—and provide the right visual tools, students stop feeling like they are falling behind and start feeling like they are in the driver’s seat.
If your child is struggling with math concepts, EinstyAI is here to help. We turn dry, textbook-style homework into custom-tailored story problems that match your child’s passions, helping them build the confidence to solve any equation. Visit EinstyAI today to turn your next homework battle into a celebration of learning.
PRACTICE QUESTIONS:
RACE TRACK PROBABILITY
1. The Starting Line
At the Grand Prix, 20 cars are ready to race. 15 are red, 3 are blue, and 2 are yellow. If Max picks a car at random, which outcome is most likely?
A) Picking a blue car.
B) Picking a red car.
C) Picking a yellow car.
D) Picking a green car.
2. The Many-to-One Graph
The “Fast Lap” graph shows race wins. The key says: 1 Car Symbol = 4 Wins. Max sees 3 car symbols in the “Turbo Team” row. How many wins did the Turbo Team have?
A) 3 wins.
B) 7 wins.
C) 12 wins.
D) 4 wins.
3. The Impossible Turn
Max is looking at a bag of racing tokens. The bag contains only blue and red tokens. How would you describe the likelihood of picking a green token?
A) Certain.
B) Likely.
C) Unlikely.
D) Impossible.