Ever wonder why your child finds math homework exhausting but can spend hours meticulously sorting their LEGO collection or trading cards? The difference isn’t their ability—it’s the context. Many parents assume that children “just aren’t math kids” if they struggle with abstract numbers on a page. In reality, math becomes a battle when it feels disconnected from their world.
Statistics and Probability don’t have to be intimidating. In Year 1, we aren’t looking for complex calculus; we are teaching children to observe, record, and interpret their environment. The secret to mastering this is moving from the abstract to the concrete: teaching them that data is simply a story told in numbers.
Why Tally Marks are a Game Changer
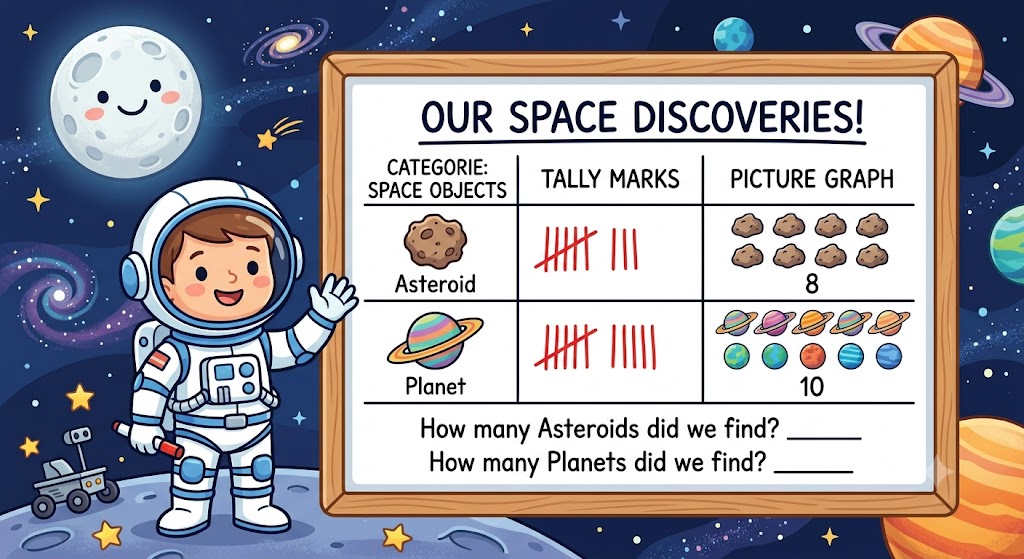
Before children can graph data, they must learn to gather it. Tally marks are the ultimate tool for this. They are simple, fast, and visual.
When your child records what they see, they are actively participating in the math. Encourage your child to use tally marks for everyday observations. How many red cars pass the house? How many blue birds are in the tree? When they create a “tally list,” they are building the foundation for data literacy.
From Tallies to Pictures: Making Math Visual
Once the data is gathered, it needs to be organized. This is where picture graphs come in. A picture graph turns those abstract tally marks into a clear visual representation.
Strategy Tip: Show your child that one symbol equals one item. This is the “one-to-one correspondence” rule. If you have 3 tally marks for “Stars,” your graph should have 3 star stickers or drawings. It turns a list into a picture, making it instantly readable.
Start Your Math Journey Today
Don’t wait for the next homework assignment to make math engaging. At EinstyAI, we transform dry curriculum outcomes into stories that stick. By aligning math practice with topics your child actually cares about, we turn the “homework battle” into a moment of discovery.
Stop fighting the curriculum. Start using stories that make math feel like play. Visit us at EinstyAI to find custom-tailored resources designed to help your child succeed.
Practice Questions
Space Exploration: Data Gathering Worksheet
Welcome, Space Cadet! Today, we are organizing our findings from our mission to the galaxy. Help us categorize what we found in space.
Question 1 (Tallying)
Commander Zog found some space rocks. He made a tally mark for every rock he found.
(IIII)
How many space rocks did he find?
A) 3
B) 4
C) 5
D) 6
Question 2 (Reading the Graph)
We looked at the spaceships parked at the base:
- Rocket A: 2 spaceships
- Rocket B: 4 spaceships
- Rocket C: 1 spaceship
If you were to draw this on a picture graph, which rocket would have the most pictures?
A) Rocket A
B) Rocket B
C) Rocket C
D) None of them
Question 3 (Connecting Data)
You have a list of aliens spotted: 3 Green Aliens and 2 Purple Aliens. Which picture graph shows this correctly?
A) 3 Green circles and 3 Purple circles
B) 2 Green circles and 3 Purple circles
C) 3 Green circles and 2 Purple circles
D) 5 Green circles and 0 Purple circles