
Tag: Benchmark percentages

  • How “The 2-Tone Tally” Helped Mia Design Her Way to Math Confidence

    How “The 2-Tone Tally” Helped Mia Design Her Way to Math Confidence

    Mia sat at the kitchen table, her sketchbook of fashion designs pushed aside, tears welling up. In front of her lay a messy page of statistics homework—a wall of bar graphs that looked like a confusing jungle of lines. She had to compare two different fabric preferences across four clothing types, but the data just swam before her eyes.

    The Struggle with Abstract Data

    Parents know this scene all too well. It’s that precise moment when “math” stops being about numbers and starts being about frustration. Mia wasn’t bad at math; she was overwhelmed by the way the graph presented the data. The traditional approach—trying to read two different columns at once—felt like watching two different movies on the same screen. It caused instant panic because the visual relationship between the two categories was hidden behind confusing labels.

    The Guide & The 2-Tone Tally Trick

    To help Mia, we didn’t force her to “study harder.” We introduced a simple visual weapon: The 2-Tone Tally Trick.

    This strategy is simple: instead of viewing the column graph as a big, confusing mess, you treat the two categories as two distinct fashion seasons. You assign a specific color to each category (e.g., Blue for “Summer Fabrics” and Pink for “Winter Fabrics”). By physically color-coding the columns, the abstract data instantly transforms into a clear, comparative map.

    The Transformation

    Mia looked at her assignment again. She pulled out her highlighters. “Okay,” she said, “Summer fabrics are Blue. Winter fabrics are Pink.”

    Suddenly, comparing the data wasn’t about subtracting large numbers in her head anymore. She could see the gaps. She could see that the “Denim” columns had a much smaller gap between seasons than the “Silk” columns. The panic vanished, replaced by the logical satisfaction of a designer finding a pattern. By the time she finished, she had not just answered the questions—she understood the story the data was telling.

    Turn Homework Battles into Victories

    When math is dry, it’s a chore. When it’s part of a story, it’s a puzzle waiting to be solved. At EinstyAI, we transform curriculum-aligned math problems into personalized stories that resonate with your child’s interests—whether they love fashion, gaming, or dinosaurs. Stop fighting over the homework and start making math click.

    Visit EinstyAI today to create your first custom math story.


    PRACTICE QUESTIONS

    1. The Fabric Choice

    Mia surveyed 50 designers about their favorite fabrics for a summer collection versus a winter collection. The side-by-side graph shows Denim (Summer: 15, Winter: 5) and Silk (Summer: 5, Winter: 15). How many more designers preferred Silk in winter compared to summer?

    A) 5

    B) 10

    C) 20

    D) 25

    2. The Accessory Trend

    A graph compares the popularity of “Gold” accessories vs. “Silver” accessories over two months. If Gold has 20 units in Month 1 and 30 in Month 2, while Silver has 25 in Month 1 and 25 in Month 2, which statement is true?

    A) Silver is more popular overall.

    B) Gold increased in popularity while Silver stayed the same.

    C) Gold is always more popular than Silver.

    D) The total for Gold is 40.

    3. Pattern Preferences

    Mia compares the number of students who like “Polka Dots” versus “Stripes” across two classes. Class A has 10 Polka Dot votes and 15 Stripe votes. Class B has 15 Polka Dot votes and 10 Stripe votes. How many total votes did Stripes receive?

    A) 20

    B) 25

    C) 30

    D) 35
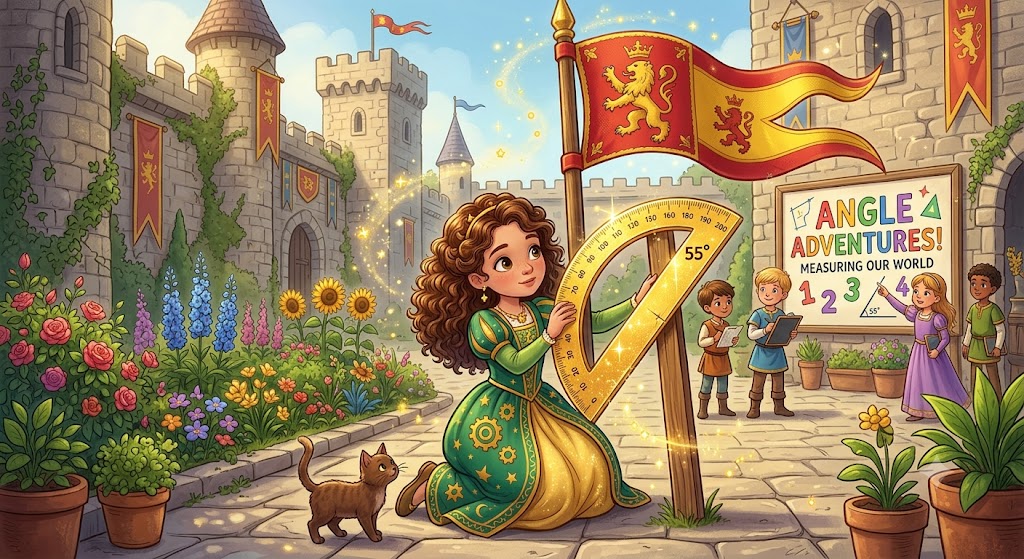
  • Unlock the Secrets of Geometry: Mastering the Protractor at Home

    Unlock the Secrets of Geometry: Mastering the Protractor at Home

    Does your child view geometry homework as a battlefield where tears are shed over plastic tools? If your Year 5 student struggles with math, you are not alone. Many parents assume their child simply “isn’t a math kid,” but this mindset is the real barrier to learning. Math anxiety often stems from abstract concepts lacking context, not a lack of innate ability. When we turn math into a story, the fear dissolves, replaced by curiosity.

    The Problem with Traditional Geometry

    Standard math sheets often present circles and lines as disconnected, boring shapes. Students stare at a page of disconnected angles and feel nothing. But geometry is the language of architecture, design, and art. In the Year 5 curriculum, students must learn to use protractors to measure angles in degrees. This requires precision and logic. If a student tries to guess, they fail. When they learn the strategy, they succeed.

    The “Protracting” Strategy for Success

    Mastering the protractor isn’t about memory; it is about a consistent three-step process. Teach your child these steps to remove the guesswork:

    • Align the Baseline: Place the protractor’s baseline exactly on one ray of the angle.
    • Center the Vertex: Ensure the small hole or crosshair at the bottom of the protractor sits perfectly on the angle’s vertex.
    • Check the Scale: Look at the scale starting at zero. If the angle opens to the left, use the outer scale. If it opens to the right, use the inner scale. Most students fail here by choosing the wrong scale and recording a 120-degree angle when they should have written 60 degrees.

    Transforming Math into a Fairytale

    At EinstyAI, we know that engagement drives mastery. Instead of forcing your child to measure generic floating angles, connect the skill to their world. Imagine a princess protecting her castle. The angle of the castle gate determines if the drawbridge can open. The angle of the tower roof ensures it can withstand heavy rainfall. By shifting the context from a worksheet to a quest, you bypass the “this is boring” wall and activate the brain’s engagement centers.

    Take Action Today

    Stop the nightly homework battles. Shift from being a “tutor” to being a “narrator” of their mathematical journey. Use the practice questions below to transform your next study session into a royal mission. Your child is capable of mastering these concepts—they just need the right map.

    Practice Questions

    The Royal Castle Geometry Challenge

    Question 1: The Drawbridge Angle

    Princess Clara is adjusting the heavy chain on the castle drawbridge. The bridge forms an angle of 45 degrees with the stone wall when lowered halfway. If she moves the chain to make the angle wider, which of these is a possible measurement for the new angle?

    A) 30 degrees

    B) 60 degrees

    C) 180 degrees

    D) 10 degrees

    Question 2: The Tower Roof Slope

    The royal architect is designing a new tower roof. To ensure the snow slides off perfectly, the roof must be an acute angle. Which of the following measurements should the architect choose for the roof’s peak?

    A) 90 degrees

    B) 105 degrees

    C) 40 degrees

    D) 180 degrees

    Question 3: The Dragon’s Wing Span

    A friendly dragon is resting in the courtyard. Its wing is folded at an obtuse angle so it fits inside the castle gates. Which of the following is a possible measurement for the dragon’s wing angle?

    A) 75 degrees

    B) 90 degrees

    C) 130 degrees

    D) 10 degrees

  • How Can I Help My Year 5 Student Master the Cartesian Plane and Perimeter?

    How Can I Help My Year 5 Student Master the Cartesian Plane and Perimeter?

    Why does your child view math problems as an unsolvable maze rather than a blueprint to build their own world? Many parents assume that math anxiety is an inherited trait—that some kids are simply “not math people.” This is a myth. When students struggle with Year 5 Measurement and Space concepts, it is rarely because they lack ability. It is because the abstract concepts feel disconnected from reality.

    The Problem: Math in a Vacuum

    In Year 5 (Stage 3), students are introduced to the Cartesian plane and the calculation of perimeters for composite shapes. Without context, a grid of coordinates and a series of lines are just numbers on a page. This is where disengagement starts. Children do not learn mathematics by staring at textbooks; they learn by interacting with their environment.

    The Solution: Building with Coordinates

    The Cartesian plane is essentially a map. If your child plays Minecraft, they are already using coordinate geometry. Every block placed in a Minecraft world occupies a specific x and y coordinate. When we shift the focus from rote memorization to spatial reasoning, the math becomes intuitive.

    To teach perimeter of composite shapes, stop asking for “perimeter” and start asking for the “fencing required to secure a base.” A composite shape is just two simple rectangles joined together. The secret trick is to treat the shape like a room layout. Instead of guessing the missing sides, break the complex shape into two smaller, simple rectangles. Calculate their perimeters individually, then subtract the shared wall. This prevents the common trap of counting interior lines.

    Master the Grid Today

    If your child struggles with math, stop the “drill and kill” homework sessions. Connect the curriculum to the games they love. When they calculate the perimeter of a virtual base, they aren’t just doing math; they are engineering. Math is not a battle to be won; it is a tool to be used.

    Practice Questions

    Theme: The Minecraft Architect Challenge

    Question 1: The Diamond Coordinates

    Steve is placing a rare Diamond Block on his base grid. The base starts at (0,0). Steve places the block exactly 3 units to the right and 4 units up from the starting point. What are the coordinates of the Diamond Block?

    A) (4, 3)

    B) (3, 4)

    C) (3, 3)

    D) (4, 4)

    Question 2: Protecting the Base

    Steve builds a rectangular crafting room that is 5 metres long and 4 metres wide. What is the total perimeter of this room?

    A) 9 metres

    B) 18 metres

    C) 20 metres

    D) 15 metres

    Question 3: The L-Shaped Lookout

    Steve builds an L-shaped lookout tower. The horizontal bottom is 6 metres wide. The vertical left side is 8 metres high. The top horizontal arm is 2 metres, and the vertical drop is 4 metres. The remaining two sides close the shape. Assuming all angles are right angles, what is the total perimeter of the lookout?

    A) 20 metres

    B) 24 metres

    C) 28 metres

    D) 32 metres